
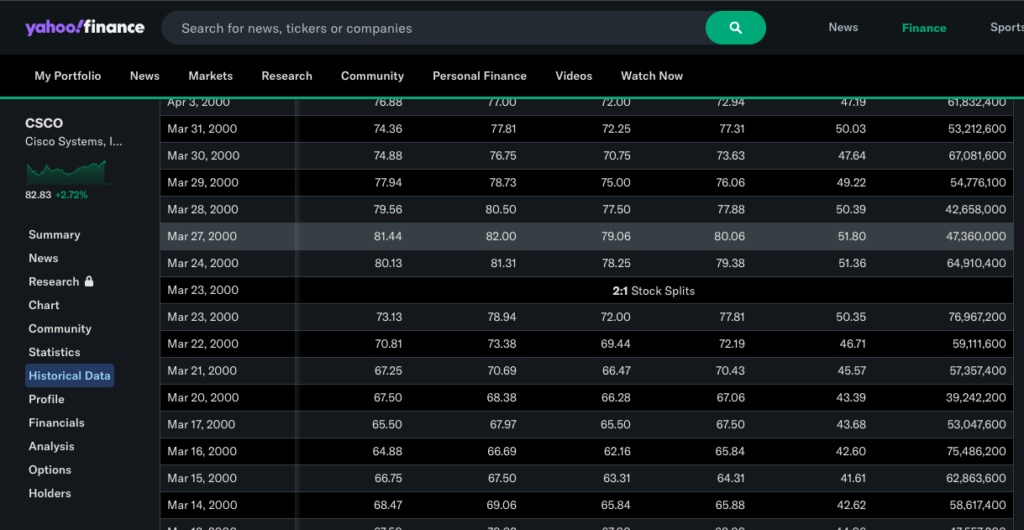
March 27, 2000. That was the previous all-time intraday trading high for Cisco stock until this morning. If you held on for 6,501 trading days, congratulations you are finally above water again. OK, well with dividends you are comfortably ahead, but just on headline price after 26 years $CSCO has attained an all-time intraday high.
What all happened in-between? Oh, just 9/11, wars in Afghanistan and Iraq, hurricane Katrina, the Bali tsunami (don’t remember that? It claimed 230,000 lives), the great financial recession, first black US president, Fukushima Nuclear disaster, storming of the US Capitol, global COVID-19 pandemic, land war in Europe, Facebook, iPod, Youtube, iPhone, Netflix (streaming), cloned animals, generative AI. And of course the dot-com bust that started it all, and happened with the largest company on Earth by market cap (CSCO) reaching $82 per share.
As for me, I was 29 years old – not even 30 yet. Our first child Austin was only 2 years old, probably just finishing up potty training. We had just moved into our home we had custom built in Moore, OK – 213 N Olde Bridge Road. I was so mad at myself for letting the builder put the house too close to the road.
What happened to Cisco stock post March 27, 2000? Well, it was pretty quick on the way down:
- 70.75 on March 30, 2000 ( 10%+ lower, 3 trading days later)
- 55.06 on April 14, 2000 (30%+ lower, 14 trading days)
- 50.00 flat on May 22, 2000 (40% lower, 40 trading days)
- 32.63 on Jan 2, 2001 (60% down, 160 trading days)
- 15.00 flat on March 19, 2001 (80% lower, 1 year later)
- 11.04 on September 27, 2001 (85% lower, 1.5 years later)
- 8.12 on October 8, 2002 (90% wiped out, 2.5 years later)
So from $82 to $8. That October 2002 price was the all time low, during the GFC the price was in the high teens.
How about post Oct 2002 – what was the path on the way up?
- 9.21 on October 8, 2002 (10%+ higher, intraday)
- 11.00 flat on Oct 15, 2002 (30%+ higher, 5 trading days later)
- 15.48 on November 21, 2002 (90% higher, 25 trading days)
- 20.57 on Sept 3, 2003 (150% up, 1 year later)
- 30.00 flat on July 16, 2007 (270% up, 5 years later)
- 40.24 on Jan 10, 2018 (400% up, 16 years later)
- 83.24 on Feb 3, 2026 (1,000% up, ¼ century later)
Interesting the early milestones on the way down are slightly longer (3 days, 14 days, 40 days) than the early milestones on the way up (intraday, 5 days, 25 days) – meaning the market gives you very little opportunity to sell the true highs and even less opportunity to buy the true lows.
The later milestones on the way down are much shorter (1 year, 1.5 years, 2.5 years) than the way back up (5 years, 16 years, 24 years). You have to have patience if you are investing (not trading). And sometimes if you don’t trade you are left with generationally lost money.
Here are some photos of yours truly back at the now previous zenith of the stock in March 2000


Actually though, Cisco is not exactly at an all-time high today. Back in March 2000 the market cap of CSCO was $500B. We spent so much money in stock buybacks and net retiring shares that now the market cap is $330B. But if you throw back in the dividends then yes, it is effectively greater today than it was in absolute terms (not inflation adjusted terms) in 2000. To get whole on an inflation adjusted basis (still accounting for dividends reinvested) we need to stock to trade at about $100/share. My money is we will get there soon. There is this AI thing that people are talking about… (Did I mention we actually used to own infiniband (Topspin) and we killed it, but it came back?) So many things happen in 26 years.